Test rigs
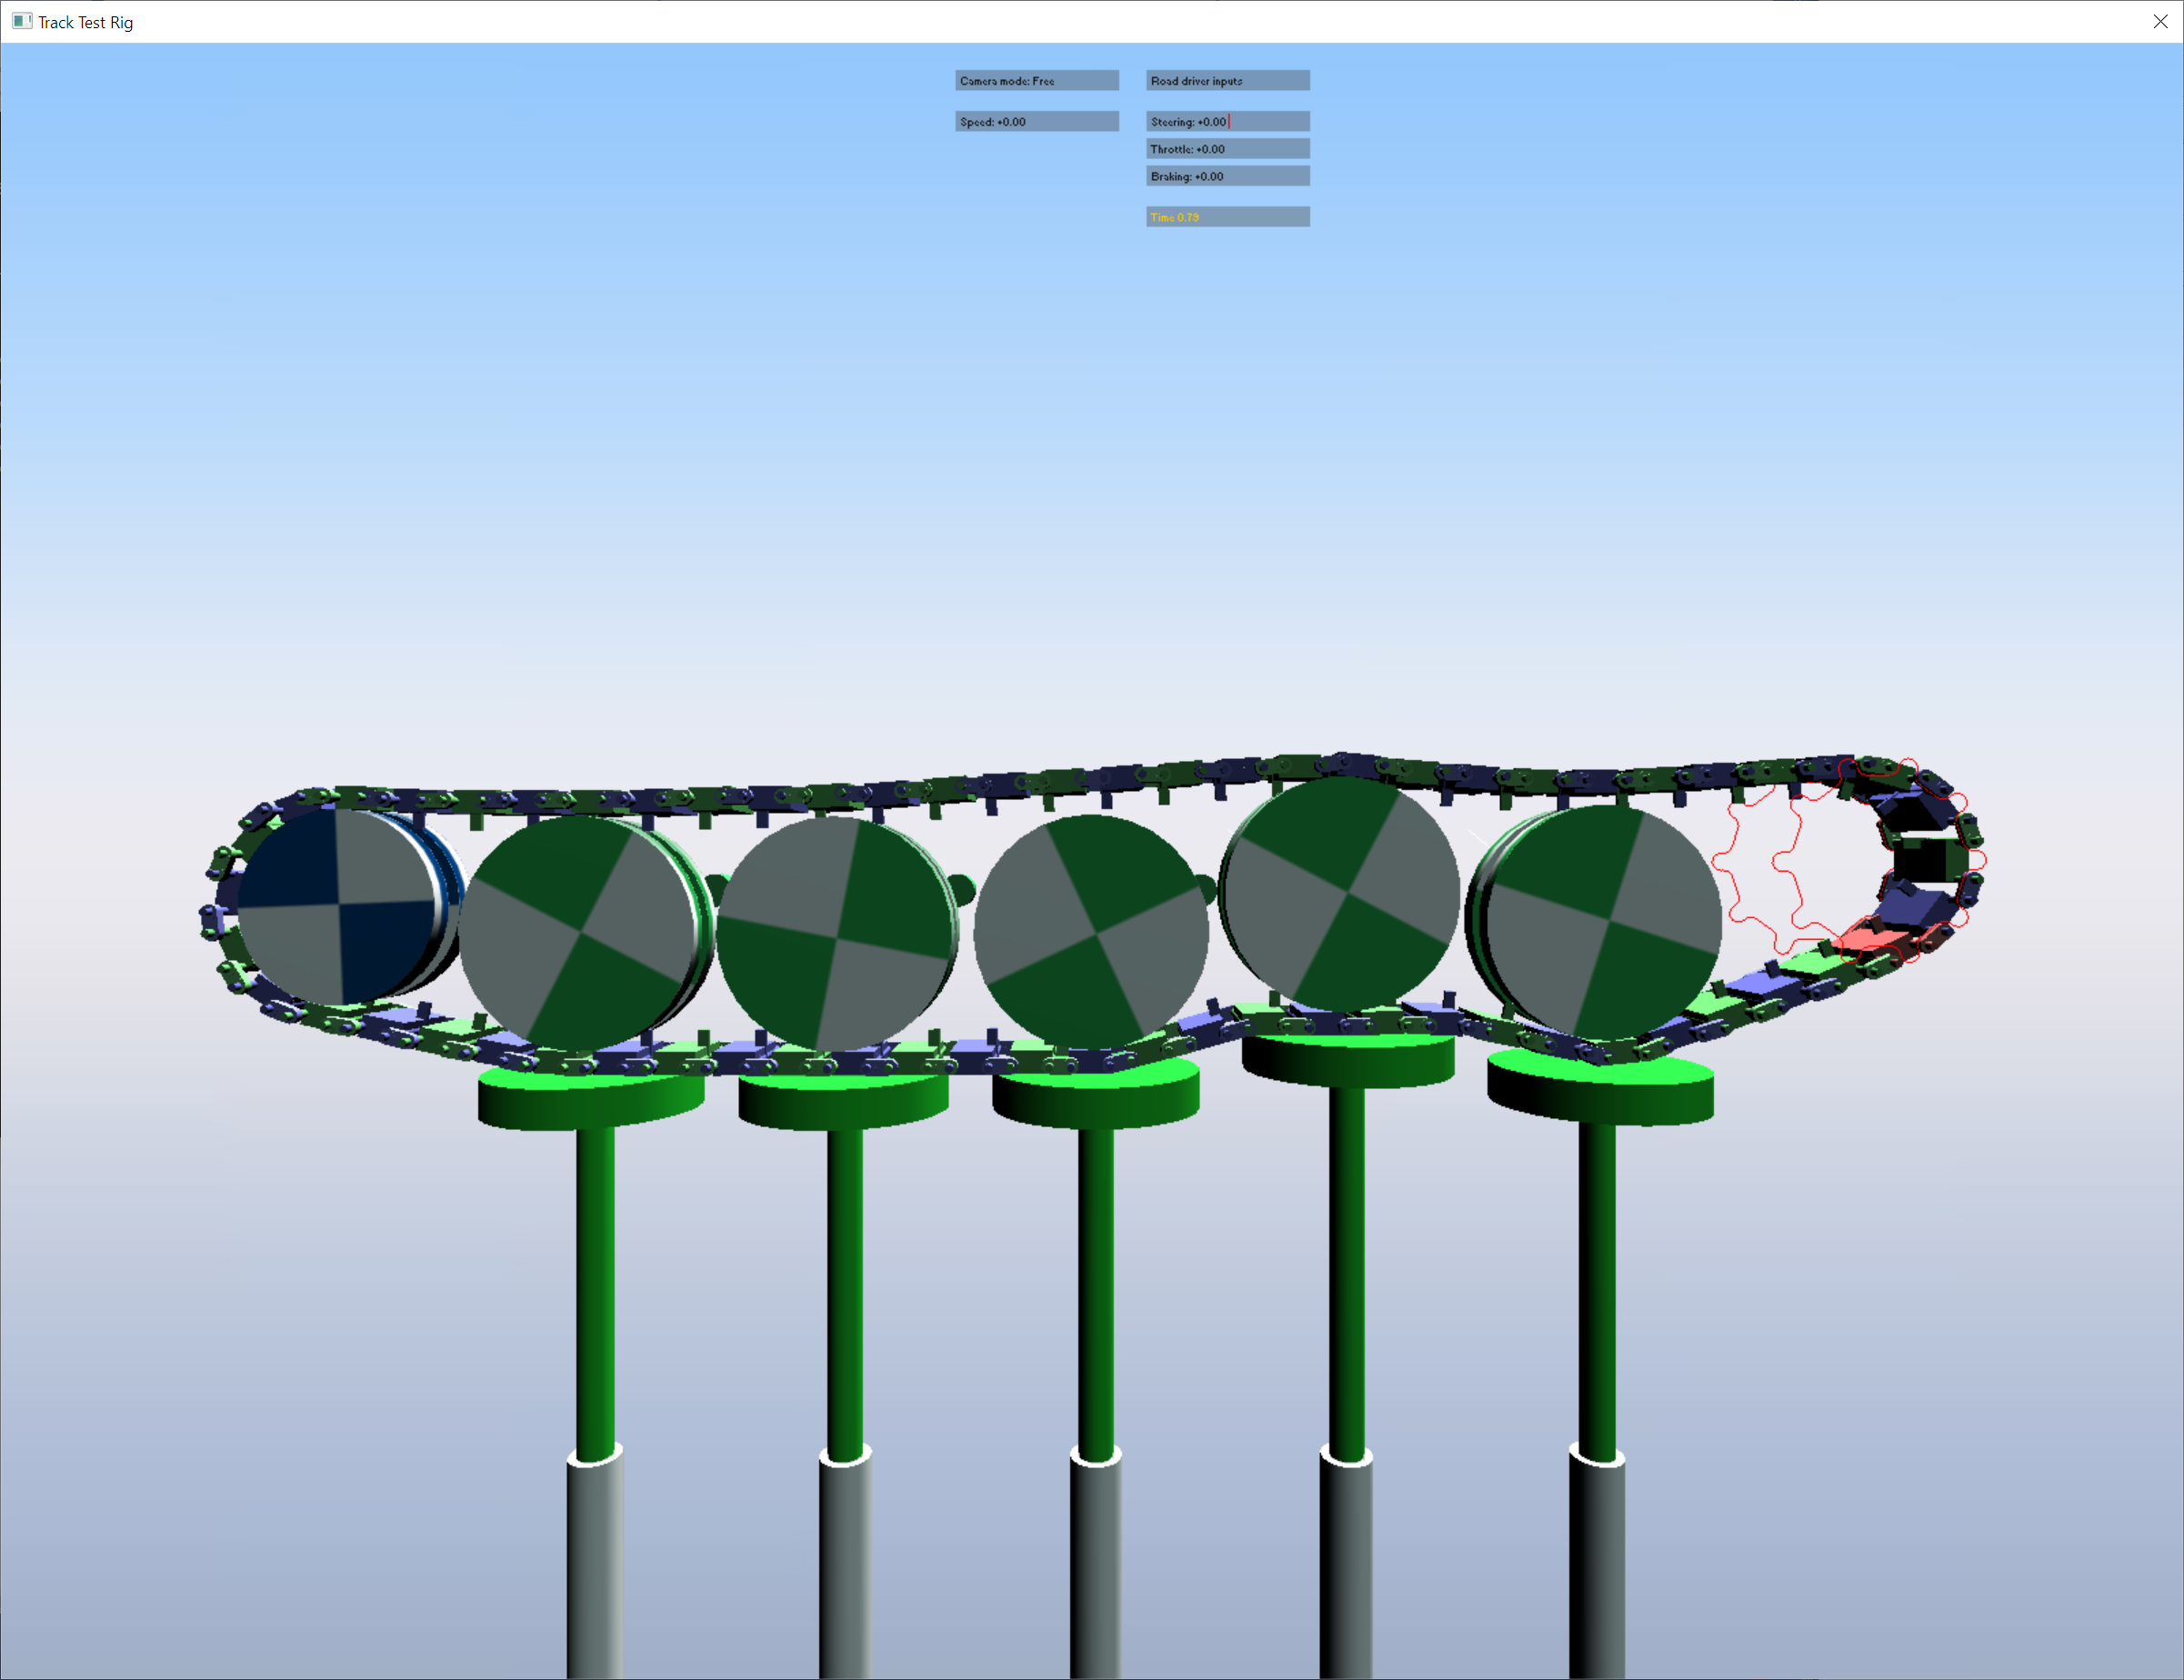
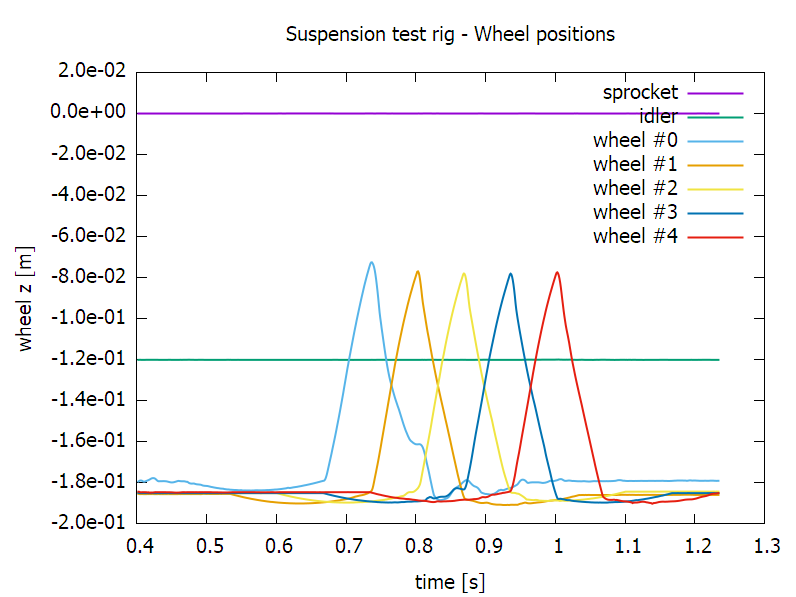
The images below show a snapshot from a simulation of a single-pin track assembly in a ChTrackTestRig (with actuation corresponding to driving over a bump at 10 m/s) and a sample output plot.
The road profile used in this simulation was specified through the following input data file:
0 0
2.0000 0
2.0100 0.0010
2.0200 0.0039
2.0300 0.0089
2.0400 0.0157
2.0500 0.0245
2.0600 0.0351
2.0700 0.0476
2.0800 0.0618
2.0900 0.0778
2.1000 0.0955
2.1100 0.1147
2.1200 0.1355
2.1300 0.1577
2.1400 0.1813
2.1500 0.2061
2.1600 0.2321
2.1700 0.2591
2.1800 0.2871
2.1900 0.3159
2.2000 0.3455
2.2100 0.3757
2.2200 0.4063
2.2300 0.4373
2.2400 0.4686
2.2500 0.5000
2.2600 0.5314
2.2700 0.5627
2.2800 0.5937
2.2900 0.6243
2.3000 0.6545
2.3100 0.6841
2.3200 0.7129
2.3300 0.7409
2.3400 0.7679
2.3500 0.7939
2.3600 0.8187
2.3700 0.8423
2.3800 0.8645
2.3900 0.8853
2.4000 0.9045
2.4100 0.9222
2.4200 0.9382
2.4300 0.9524
2.4400 0.9649
2.4500 0.9755
2.4600 0.9843
2.4700 0.9911
2.4800 0.9961
2.4900 0.9990
2.5000 1.0000
2.5100 0.9990
2.5200 0.9961
2.5300 0.9911
2.5400 0.9843
2.5500 0.9755
2.5600 0.9649
2.5700 0.9524
2.5800 0.9382
2.5900 0.9222
2.6000 0.9045
2.6100 0.8853
2.6200 0.8645
2.6300 0.8423
2.6400 0.8187
2.6500 0.7939
2.6600 0.7679
2.6700 0.7409
2.6800 0.7129
2.6900 0.6841
2.7000 0.6545
2.7100 0.6243
2.7200 0.5937
2.7300 0.5627
2.7400 0.5314
2.7500 0.5000
2.7600 0.4686
2.7700 0.4373
2.7800 0.4063
2.7900 0.3757
2.8000 0.3455
2.8100 0.3159
2.8200 0.2871
2.8300 0.2591
2.8400 0.2321
2.8500 0.2061
2.8600 0.1813
2.8700 0.1577
2.8800 0.1355
2.8900 0.1147
2.9000 0.0955
2.9100 0.0778
2.9200 0.0618
2.9300 0.0476
2.9400 0.0351
2.9500 0.0245
2.9600 0.0157
2.9700 0.0089
2.9800 0.0039
2.9900 0.0010
3.0000 0
5.0000 0