This page compares discrete element (DEM) simulations of granular materials with Chrono::Multicore against laboratory element tests on spheres: direct shear tests of glass beads (Härtl and Ooi, 2008) and drained triaxial tests of steel spheres (Cui, O'Sullivan and O'Neill, 2007). It also shows how the tangential displacement model of the contacts changes the response in both tests. Each replication uses the experiment's particles, friction coefficients, apparatus dimensions and stresses. For each test, the sections below list what was taken from the experiment and what was set for the model, and compare the results.
The programs that ran these tests and the scripts that made the figures are in the chrono-projects repository, in projects/dem_validation (see Programs).
Contact model
All tests use the smooth (penalty) contact method of Chrono::Multicore (ChSystemMulticoreSMC) with:
- Hertz contact forces (
ChSystemSMC::ContactForceModel::Hertz). - The stored tangential displacement (
ChSystemSMC::TangentialDisplacementModel::MultiStep), set throughGetSettings()->solver.tangential_displ_mode. The Chrono::Multicore default,OneStep, takes the tangential displacement over a single step only, so a contact cannot hold a static tangential force. The contact history tests below (direct shear, triaxial) show how much this changes the strength of a packing. - Young's moduli about 1000 times lower than those of glass and steel, with a time step of \(10^{-5}\) s.
- Loading faster than in the laboratory, but quasi-static: in the replications, the inertial number \(I = \dot\gamma\, d / \sqrt{p/\rho}\) (shear rate, particle diameter, pressure and particle density) stays near \(10^{-4}\) or below.
Direct shear of glass beads
Härtl and Ooi (2008) sheared 6 mm glass beads in a Jenike shear cell at normal stresses of 3.1, 6.4, 12.5 and 24.2 kPa. They filled the cell in three ways (through a central funnel, by rainfall through a sieve, and in tamped layers), and reported the porosity of each filling and the bulk friction, the ratio of shear to normal stress at limiting shear.
Jenike shear cell
Taken from the experiment:
- The cell: 143 mm inner diameter, a bottom ring 19 mm high closed by a base, and a top ring 24 mm high resting on it with no gap. The top ring starts offset by 3 mm against the shear direction, as in Härtl and Ooi's simulations, so the shear displacement starts at -3 mm.
- The beads: 6 mm, density 2550 kg/m³, restitution 0.87, Poisson ratio 0.22, friction 0.18 between beads and 0.13 against the walls.
- The normal stress as the paper defines it: the weight of the lid plus that of the beads above the shear plane.
- The top ring and the lid driven together, with the shear force taken as the contact force on them.
Set for the model:
- Young's modulus \(4 \cdot 10^7\) Pa.
- The beads rained into the cell through the top ring in layers of 40, every 0.01 s; the beads above the rim are removed before the lid is placed, leaving about 3750 beads.
- 12.1 mm of shear at 1 mm/s, 60 times faster than the experiment's 1 mm/min (inertial number about \(10^{-4}\) at 3.1 kPa).
- A smooth lid and base (the cell's are grooved), and a lid that cannot tilt.
- Three fillings (random seeds) at each normal stress.
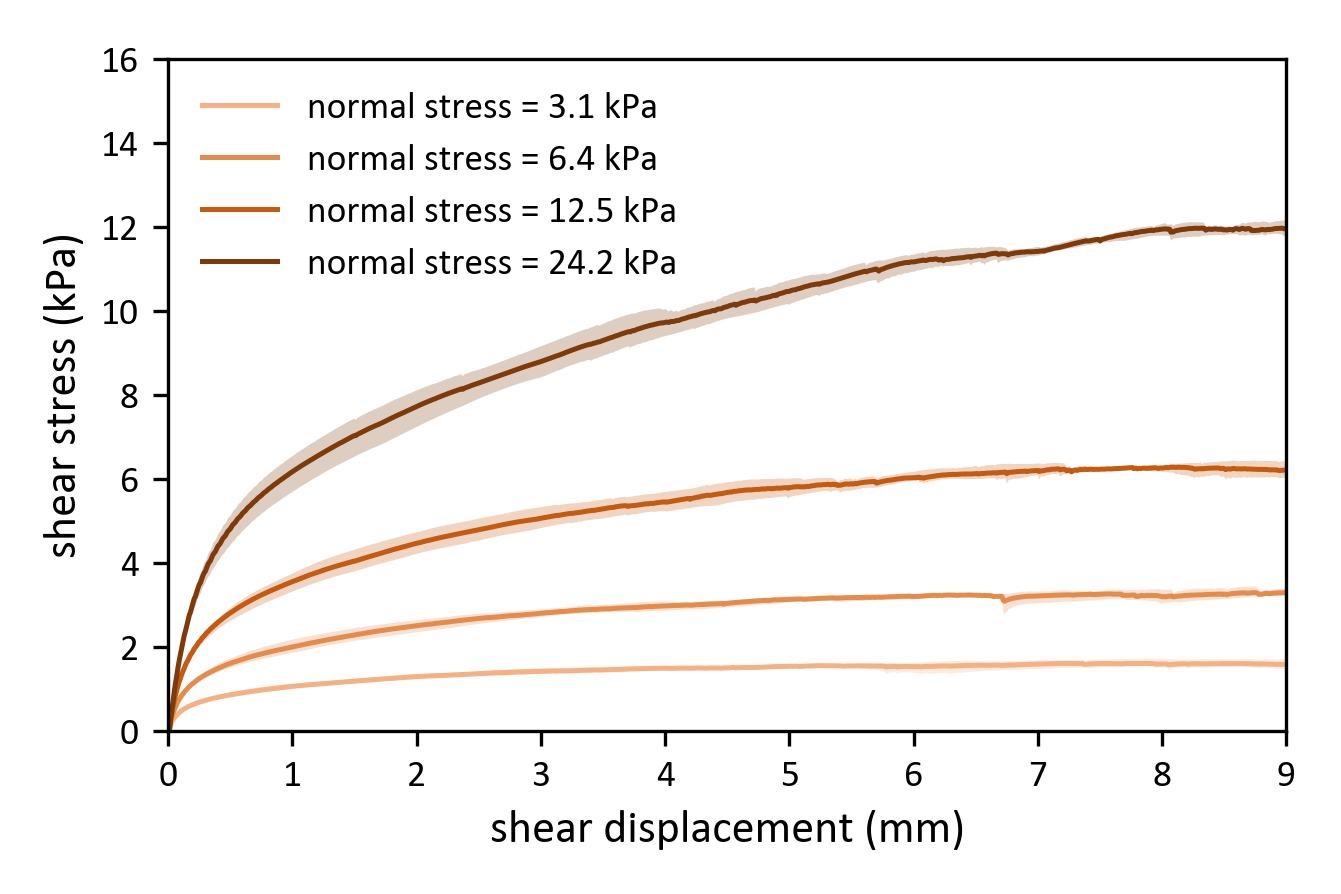
Shear stress against shear displacement at the four normal stresses, on the axes of Härtl and Ooi's Fig. 2. Each curve is the mean of three fillings, with their range as a band.
The plateau stress ratio, the mean of \(\tau / \sigma_n\) over 4 to 7.5 mm of shear, falls with the normal stress as in the experiment, but stays below the measurements:
| \(\sigma_n\) (kPa) | 3.1 | 6.4 | 12.5 | 24.2 |
|---|---|---|---|---|
| model, mean of 3 fillings | 0.500 | 0.494 | 0.475 | 0.449 |
| Härtl and Ooi, rainfall (porosity 0.400) | 0.61 | 0.58 | 0.56 | 0.56 |
| Härtl and Ooi, central filling (porosity 0.411) | 0.54 | 0.51 | 0.52 | 0.49 |
The model is 0.09 to 0.13 below the rainfall tests and 0.02 to 0.05 below the looser central-filling tests. At 24.2 kPa its curve levels off only near 9 mm, while the measured curves are level from about 4 mm.
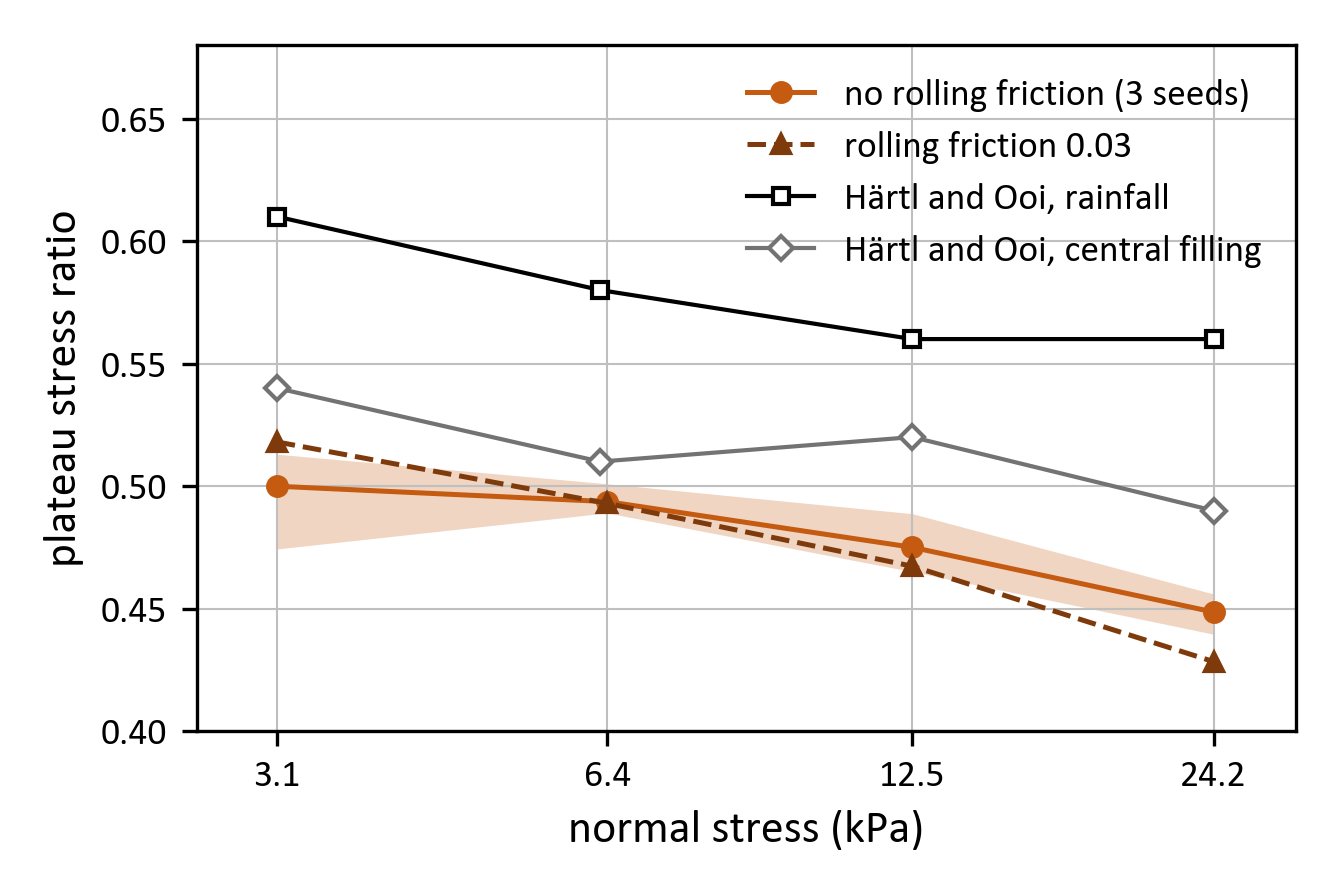
Plateau stress ratio against normal stress, without rolling friction (mean of three fillings, with their range as a band) and with a rolling friction coefficient of 0.03 (one filling), next to Härtl and Ooi's rainfall and central-filling tests (their Table 2).
Rolling friction stands in for the beads' small departure from spheres: their sphericity of 0.97 suggests a rolling friction coefficient of about 0.01 to 0.03. Chrono::Multicore applies a torque \(\mu_r R F_N\) against the relative rolling of the two surfaces while their rolling speed exceeds a threshold. These runs set the threshold to \(10^{-6}\) m/s, because the default, \(10^{-4}\) m/s, is as large as the rolling speeds in this test. At \(\mu_r = 0.03\), the plateau ratio moves by -0.012 to +0.007, less than the scatter between fillings. Two other changes leave the gap to the experiment in place as well: the experiment's grooved lid and base give plateau ratios within 0.015 of the smooth cell, and beads ten times stiffer give 0.481 at 3.1 kPa, inside the range of the three fillings (0.474 to 0.513).
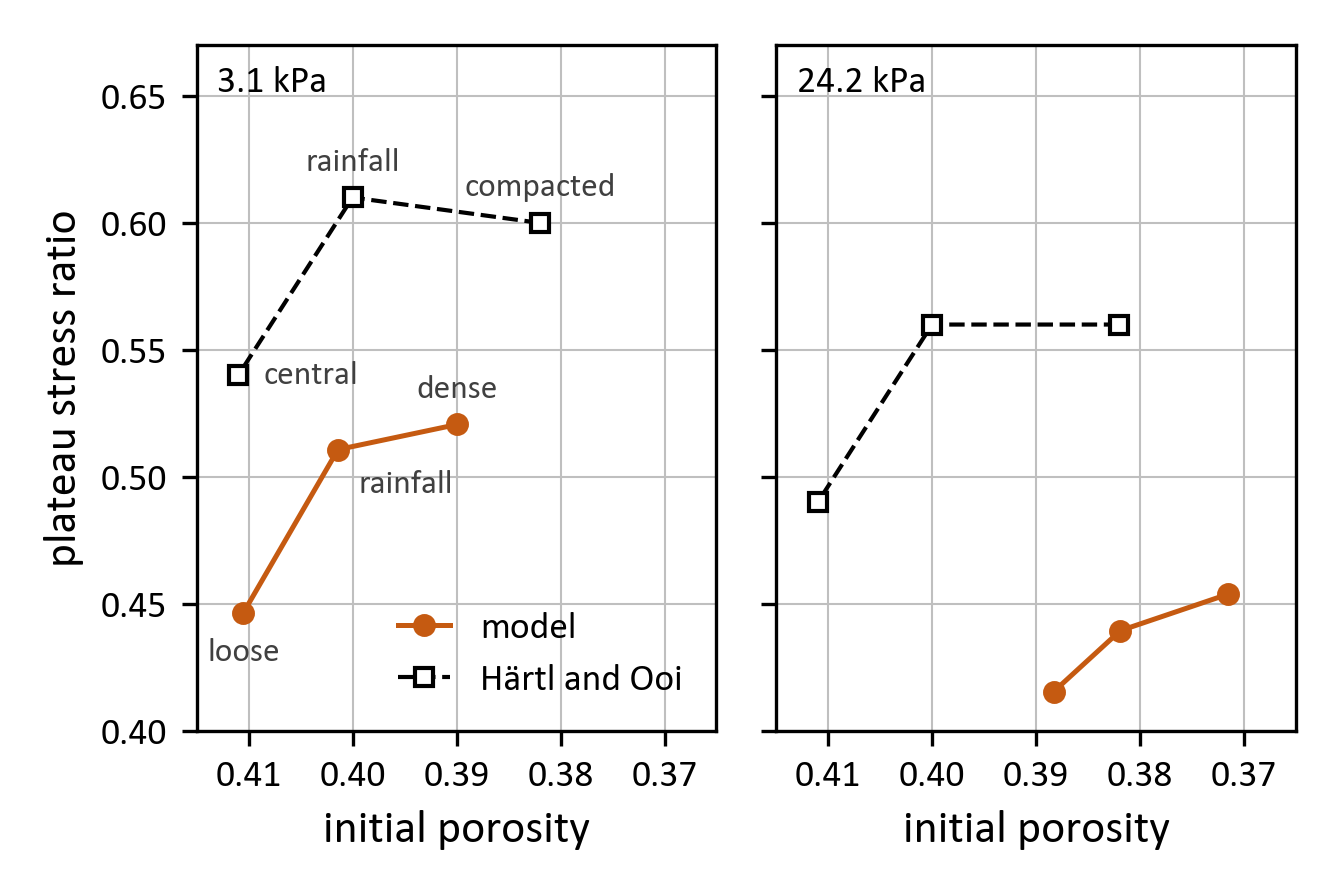
Plateau stress ratio against the porosity at the start of shearing, at 3.1 and 24.2 kPa, for three fillings of the model (loose, rainfall, dense), next to Härtl and Ooi's three filling methods (central, rainfall, compacted; their Tables 2 and 3).
The model's fillings do not reproduce the experiment's filling methods: all three are rained in, the loose one at a higher rate and the dense one with frictionless beads until the lid is placed. At 3.1 kPa they show the experiment's pattern, a large step in plateau ratio from the loosest filling to the rainfall one (0.064, against 0.07 measured) and almost none from there to the densest (0.010, against -0.01), but 0.08 to 0.10 below the experiment at each filling. At 24.2 kPa the model is 0.07 to 0.12 below, with smaller steps. As in the experiment, the denser samples dilate more.
Square shear box
The same tests in a 12 cm square box with smooth walls: 5000 beads with the properties above, dropped into the box from a jittered grid. The lower box moves at 1 mm/s under the fixed upper box, and a lid of mass \(\sigma_n A / g\), free to move only vertically, applies the normal stress. The shear force is taken on the lower box. Young's modulus, time step and contact model are those of the Jenike cell.
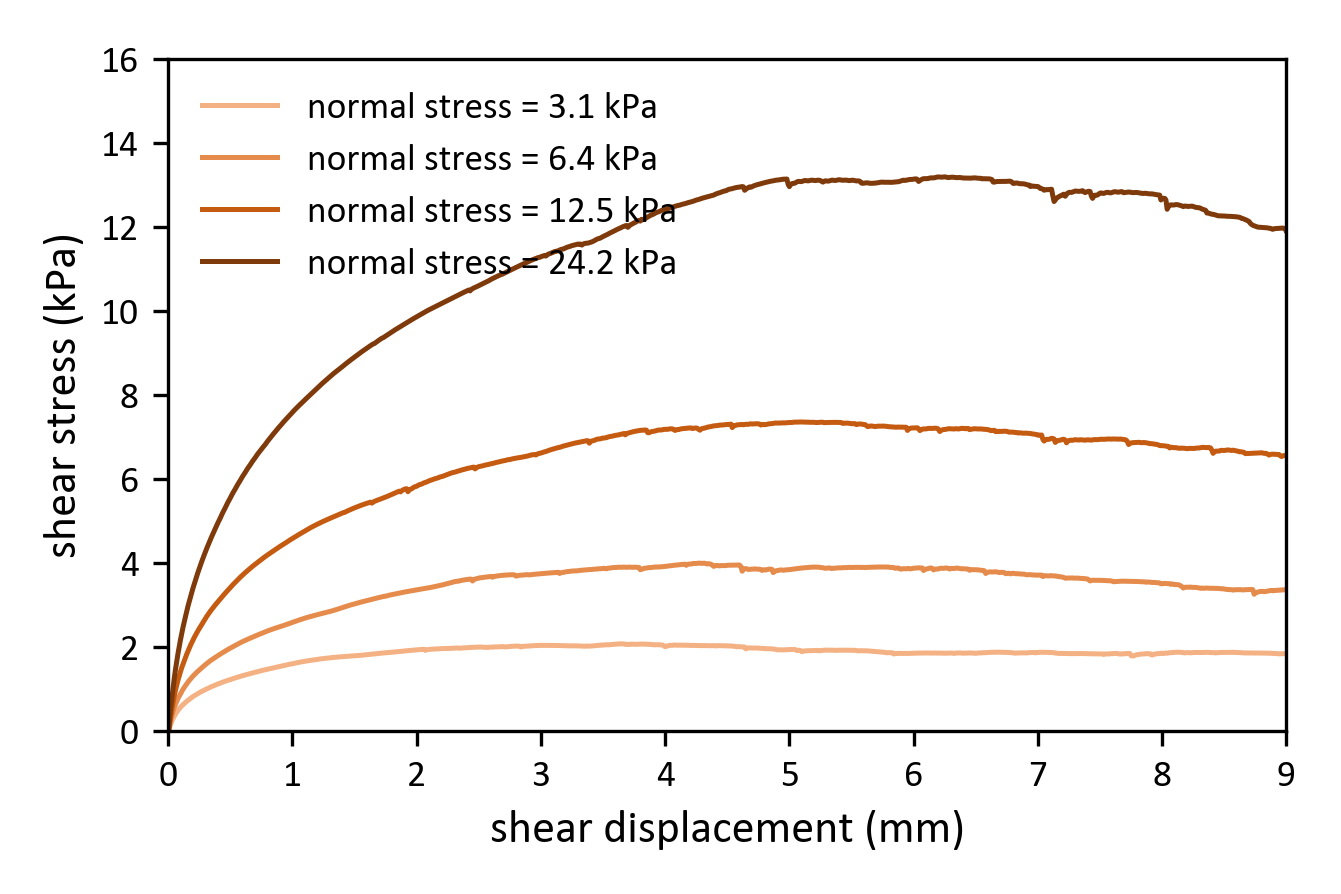
Shear stress against shear displacement in the square box at the four normal stresses, on the axes of Härtl and Ooi's Fig. 2.
With \(\sigma_n\) taken as the lid's weight over the box area, the plateau ratios (0.617, 0.600, 0.576 and 0.536) are close to the rainfall tests (0.61, 0.58, 0.56 and 0.56). Most of this agreement comes from that definition of the normal stress. The paper's normal stress also counts the beads in the upper half (2 to 19 % more), and the fixed upper box pushes down on the dilating sample (8 to 12 % more). On the normal stress the shear plane actually carries, the square box gives 0.47 to 0.50, within 0.04 of the Jenike cell on the same basis (0.44 to 0.48).
The square box at 3.1 kPa through 10 mm of shear, cut at its vertical mid-plane. The beads behind the cut are drawn in gray stripes set at the start of shearing, so the shear band shows as an offset of the stripes. The contacts in a slab behind the cut are drawn as cylinders whose radius and color grow with the normal force.
Contact history
This test uses the sample of the contact-history study of Fleischmann et al. (2016): 1800 spheres of 5 mm in a 6 cm square box, with density 2500 kg/m³, Young's modulus \(8 \cdot 10^6\) Pa, Poisson ratio 0.3, restitution 0.9, and friction 0.5 for spheres and walls (0.05 while the lid compacts the sample), under a normal stress of 1 kPa. One sample, prepared with the stored tangential displacement, is sheared over two sphere diameters with each tangential displacement model of Chrono::Multicore:
MultiStep: the tangential displacement accumulated over the life of the contact.OneStep: the tangential displacement over one step, \(u_t = v_t \Delta t\).None: no tangential displacement; a tangential damping force, capped by the Coulomb limit, remains.
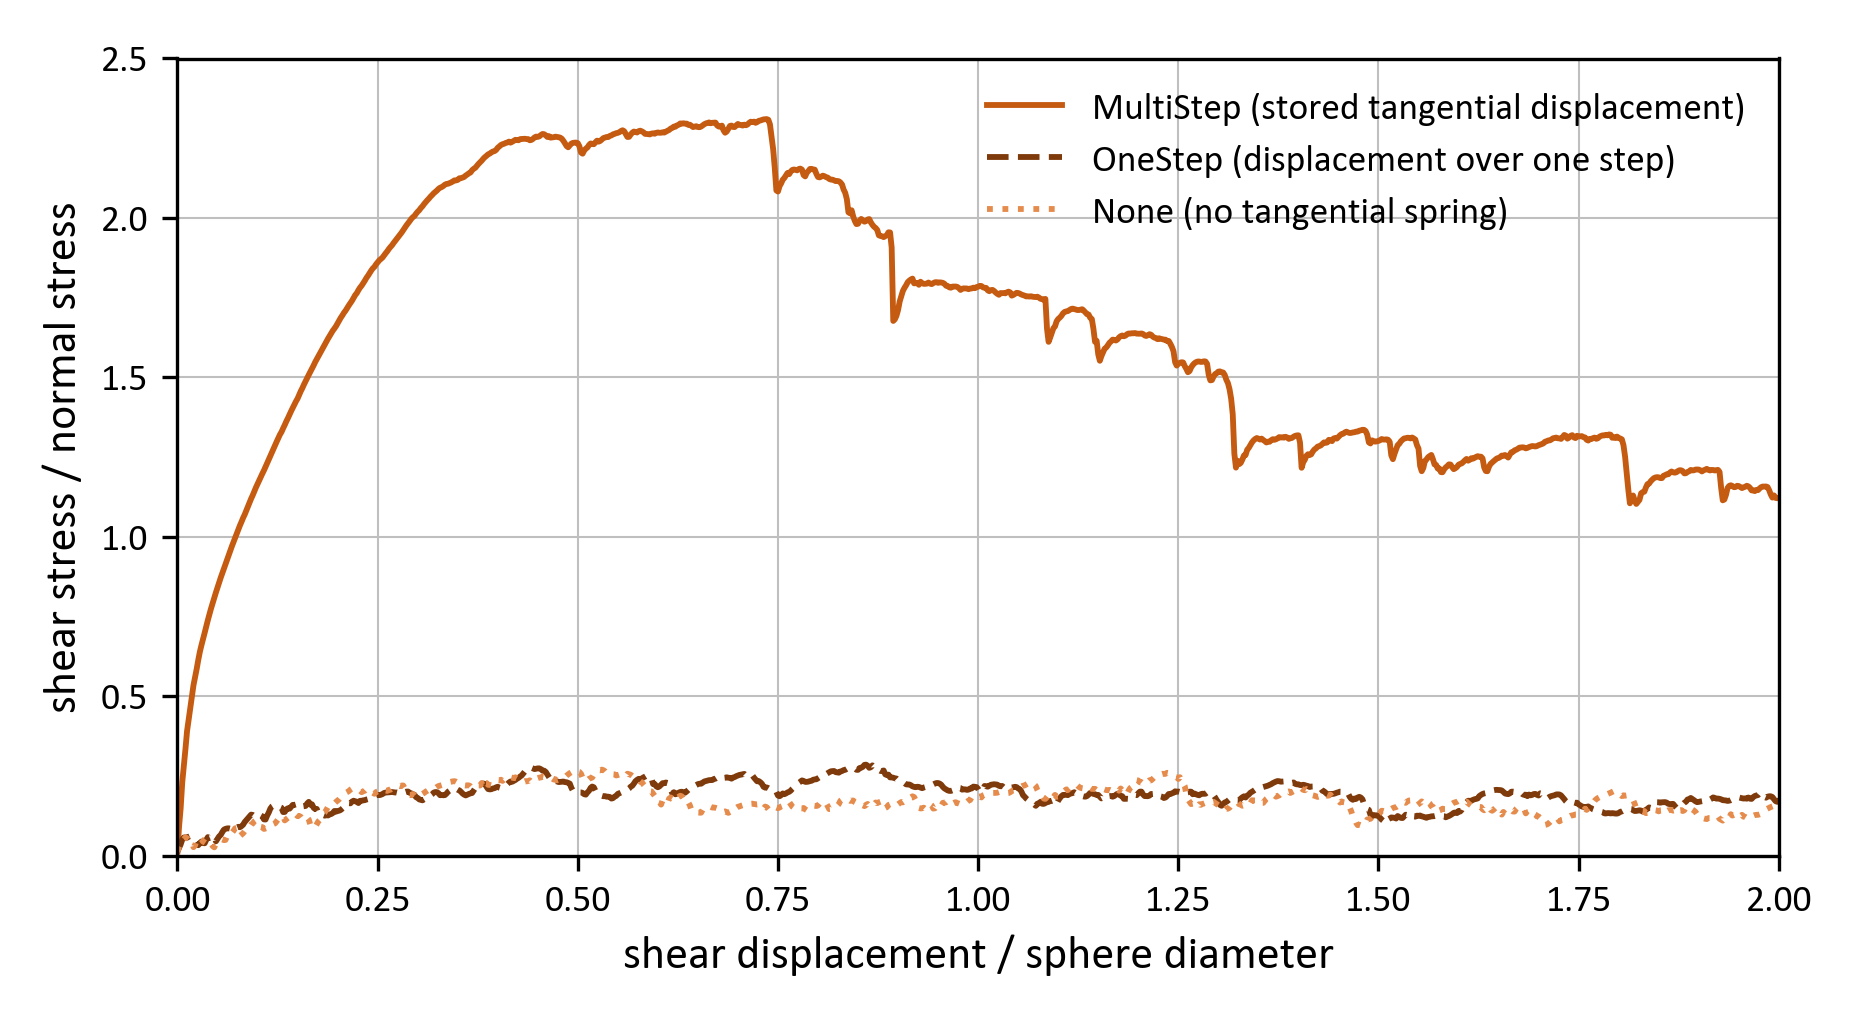
Stress ratio against shear displacement for the same sample sheared with each tangential displacement model.
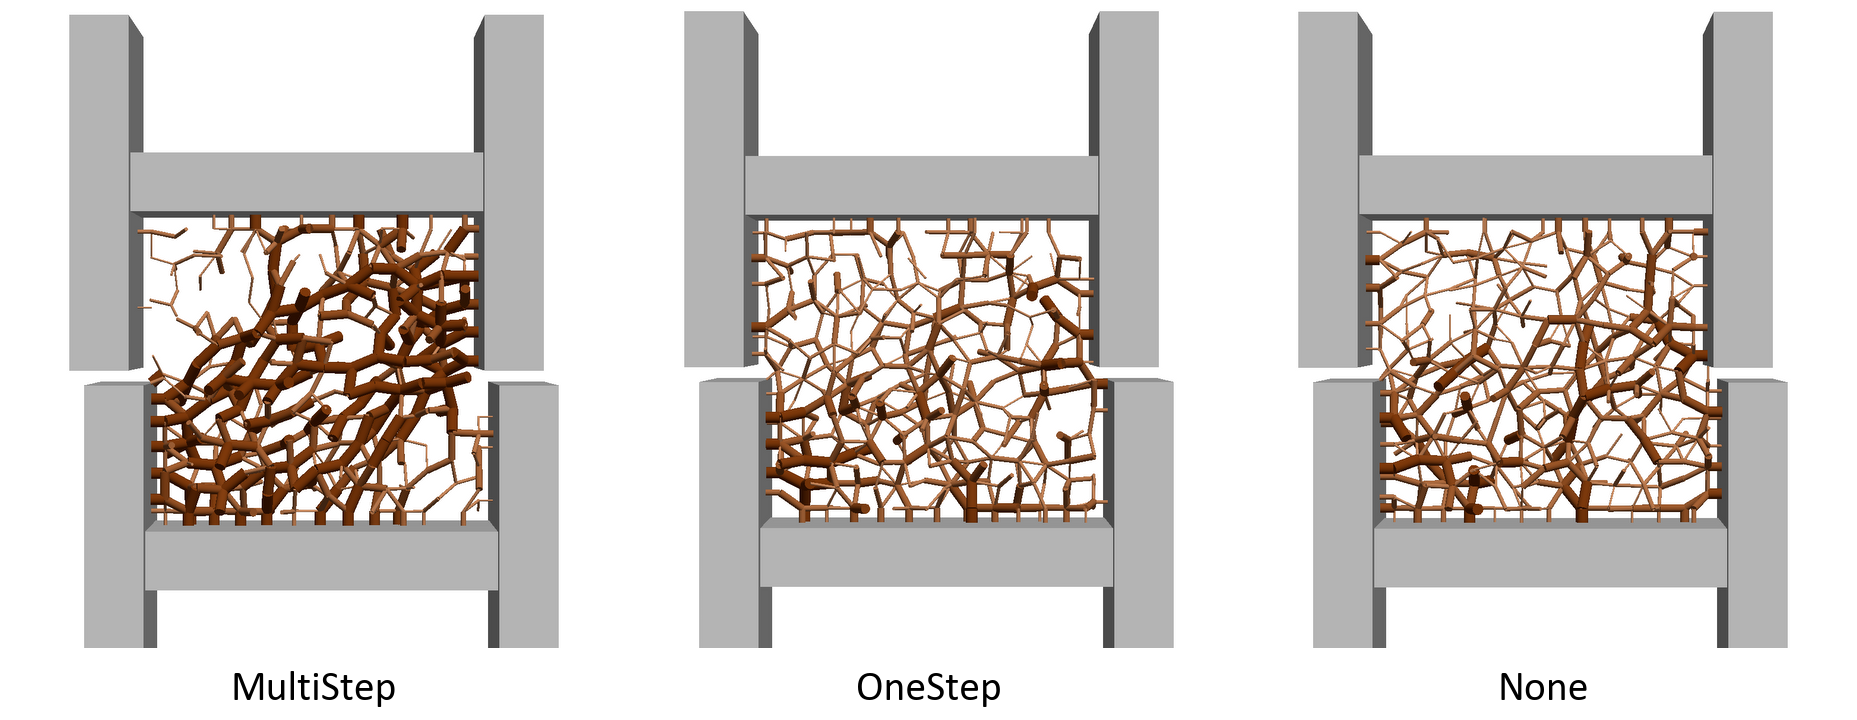
Contact force networks of the three runs at half a sphere diameter of shear, in a slice 1.5 diameters thick. The radius and color of the cylinders grow with the normal force, on the same scale in all three panels.
With MultiStep the stress ratio peaks at 2.31 near three quarters of a diameter and softens to 1.21 by two diameters, and the sample dilates by 0.6 diameters. Fleischmann et al.'s Fig. 2 shows a peak of about 2.0 near half a diameter and the same softening to about 1.2. With OneStep or None the ratio stays below 0.3, and the sample compacts. At half a diameter, a fifth of the MultiStep contacts slide at the Coulomb limit, strong chains form along the compression diagonal, and the mean normal force doubles. Without the stored displacement, the tangential forces stay at about 1 % of the Coulomb limit and the network stays weak and nearly isotropic.
Drained triaxial test of steel spheres
Cui, O'Sullivan and O'Neill (2007) tested cylindrical specimens of chrome steel spheres, 101 mm across and 203 mm high, in drained triaxial compression at a cell pressure of 80 kPa: specimens of 5 mm spheres (monodisperse) and of a 1:1:1 mixture of 4, 5 and 6 mm spheres (polydisperse).
Taken from the experiment:
- The specimen size and the spheres: density 7800 kg/m³, Poisson ratio 0.28, friction 0.096 between spheres and 0.228 against the platens.
- The cell pressure, 80 kPa, held constant.
- For the comparison, the axial stress on the cross-section at the start of the test (no area correction), as the paper reports it.
Set for the model:
- 15,400 spheres (monodisperse) or 14,350 in equal numbers of the three sizes (polydisperse): the counts that fill 203 mm at the laboratory's density.
- Young's modulus \(2 \cdot 10^8\) Pa (steel: \(2 \cdot 10^{11}\) Pa), restitution 0.597, gravity on.
- The spheres placed at random in a tall rigid mold and settled with friction off. The top platen is then placed, the specimen is consolidated to the cell pressure by a stress-controlled membrane and a stress servo on the top platen, and the mold is lifted clear.
- The membrane is Cui et al.'s rule: each peripheral sphere with no contact pointing outward carries the cell pressure times its Voronoi area on the unrolled membrane, along the inward normal.
- Platens 1.5 times the specimen diameter, so that no sphere can leave the specimen past a platen edge as it bulges.
- The top platen driven down at 5 %/s to 25 % axial strain, 600 times faster than the experiment's 0.0083 %/s (inertial number \(7.3 \cdot 10^{-5}\)).
- A friction composition that takes the larger of the two friction coefficients at a contact (the default takes the smaller), so that the platens' friction applies at the sphere-platen contacts.
- Three specimens (random seeds) of each kind.
Comparison with the laboratory
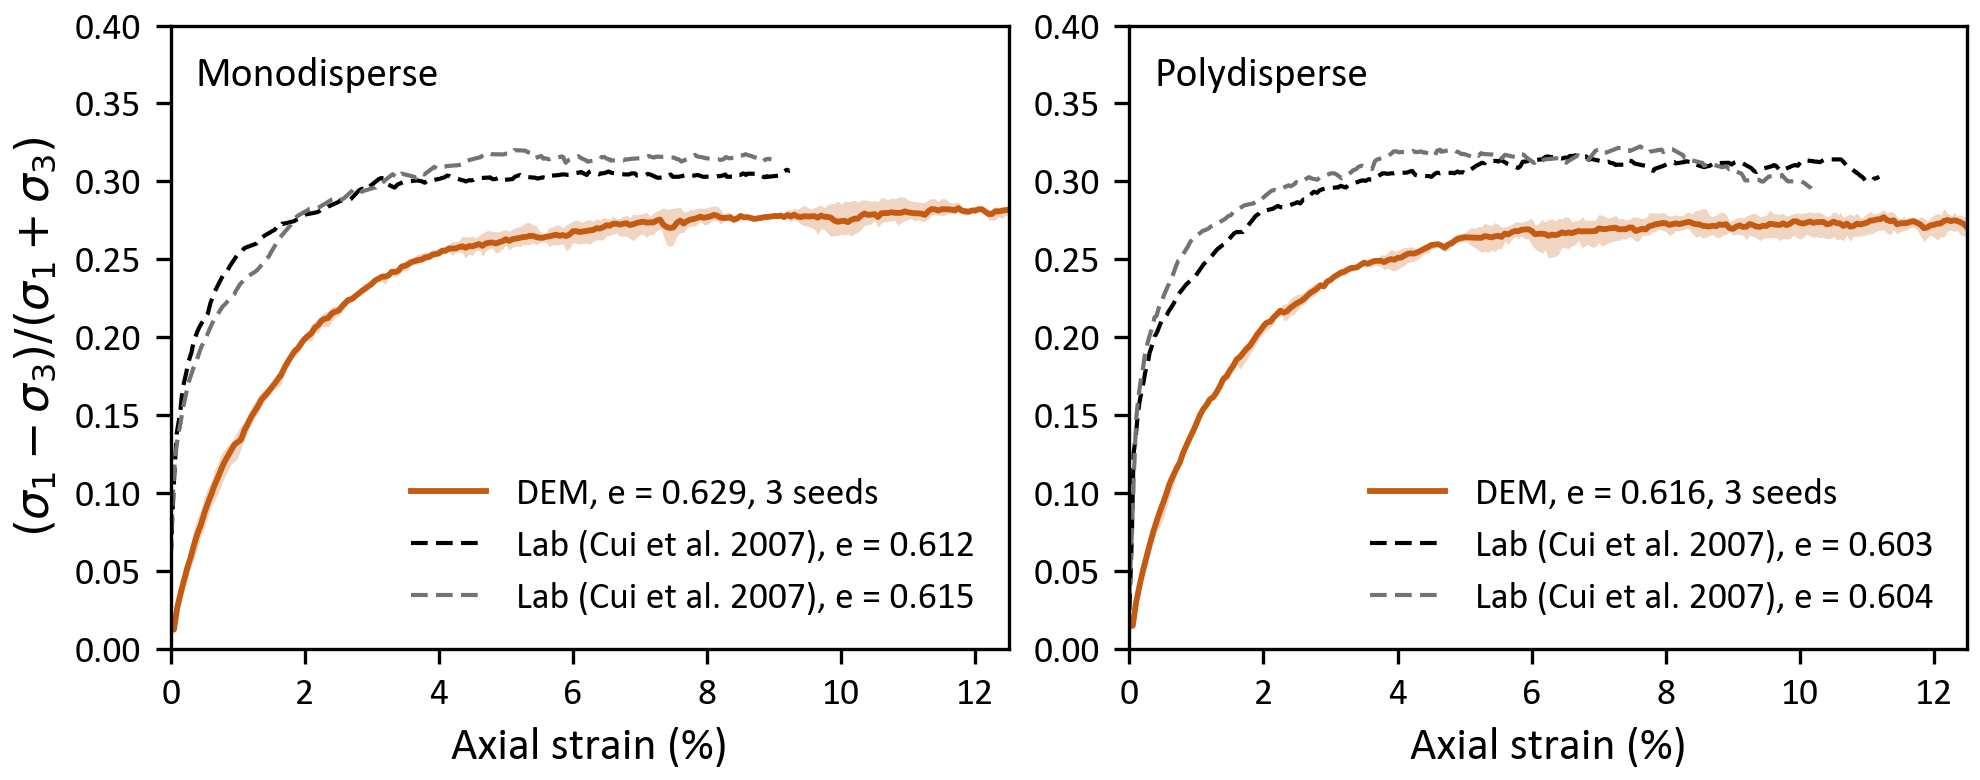
Stress ratio \((\sigma_1 - \sigma_3)/(\sigma_1 + \sigma_3)\) against axial strain at 80 kPa, with the axial stress on the cross-section at the start of the test, for the monodisperse (left) and polydisperse (right) specimens: the model (mean of three specimens, with their range as a band) and two laboratory tests each (Cui et al.'s Fig. 4). The void ratios \(e\) are those of the specimens as deposited.
| monodisperse | polydisperse | |
|---|---|---|
| void ratio as deposited, model | 0.626 to 0.631 | 0.614 to 0.618 |
| void ratio as deposited, laboratory | 0.612, 0.615 | 0.603, 0.604 |
| largest stress ratio to 12.5 % axial strain, model | 0.284 to 0.290 (16.5° to 16.9°) | 0.272 to 0.283 (15.8° to 16.4°) |
| largest stress ratio, laboratory | 0.307, 0.320 (17.9°, 18.7°) | 0.317, 0.322 (18.5°, 18.8°) |
The model is about 0.03 below the laboratory in stress ratio (about 2° in friction angle) and much softer at small strain: it reaches a stress ratio of 0.25 at about 4 % axial strain, the laboratory at about 1 %. No parameter was tuned to close this gap. Possible causes, none of them tested here: the softened contacts (at 80 kPa the overlaps are about 0.85 % of a diameter), the preparation (the model's specimens are slightly looser as deposited), the platen friction and end restraint, and the absence of rolling resistance.
Critical state
Five tests of the monodisperse specimen, from the same settled sample, at cell pressures of 20, 40, 80, 160 and 320 kPa (the laboratory tested 80 kPa only). The loading rate scales with the square root of the cell pressure, from 2.5 to 10 %/s, so all five tests run at the same inertial number. Stresses here are on the current cross-section, the volume enclosed by the membrane over the height, with \(p = (\sigma_1 + 2 \sigma_3)/3\) and \(q = \sigma_1 - \sigma_3\).
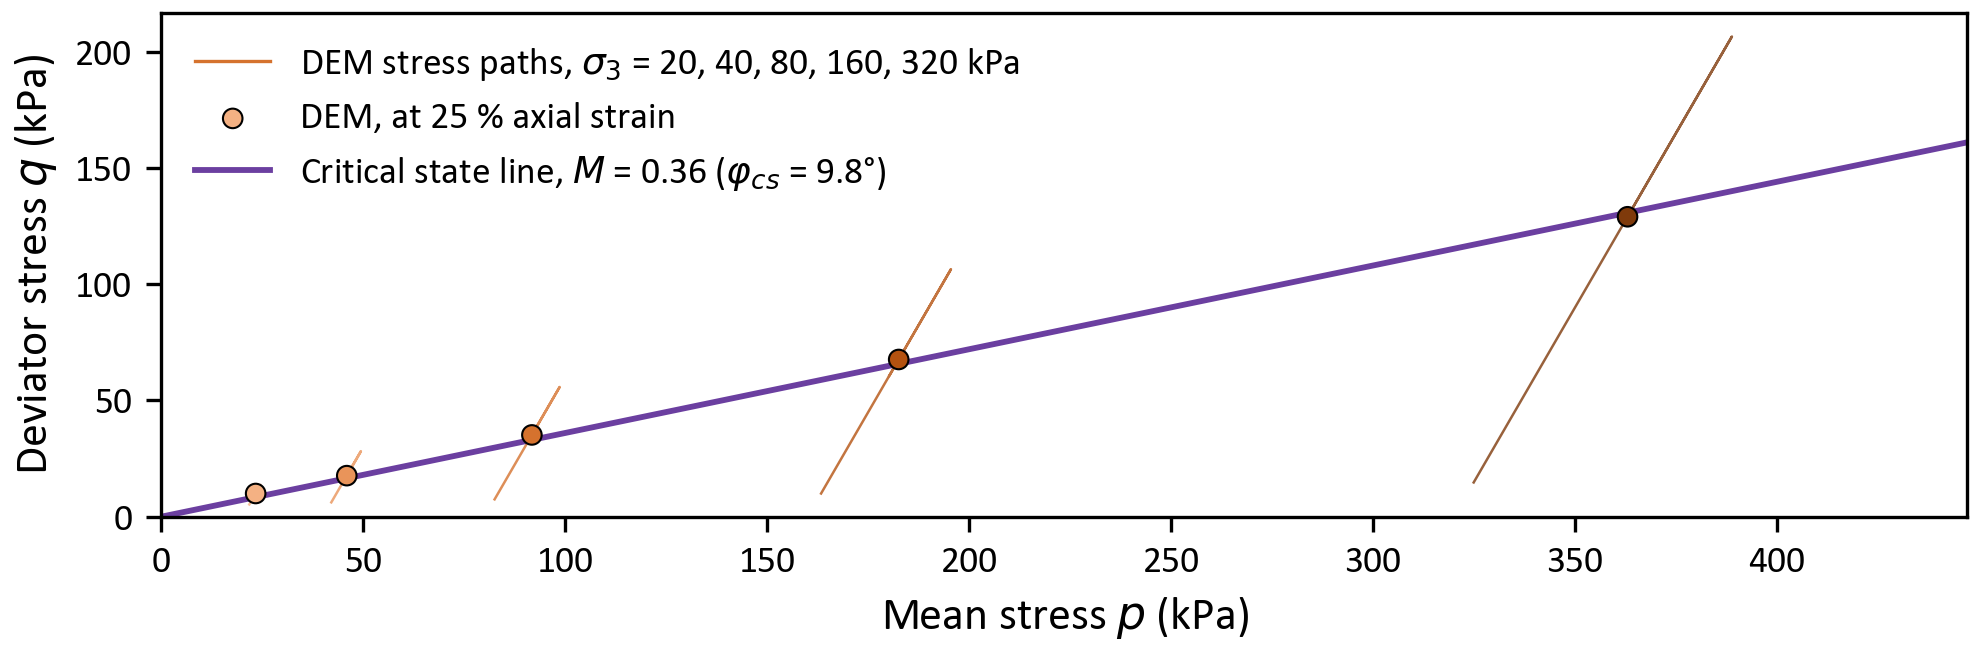
Stress paths in the \((p, q)\) plane, the states at 25 % axial strain, and the critical state line \(q = M p\) fitted through them.
The critical state line has \(M = 0.36\) ( \(\phi_{cs}\) = 9.8°). Since \(q/p\) still falls by 0.02 to 0.06 over the last 5 % of axial strain, this is an upper estimate; the scatter between specimens at 80 kPa is about ±0.02. The peak friction angle falls slightly with pressure, from 15.1° at 40 kPa to 14.1° at 320 kPa, as the specimens dilate less (2.5 % at 20 kPa, 0.8 % at 320 kPa).
These values carry over to the continuum models of Chrono::FSI-SPH. \(M\) is the slope of the critical state line of the Modified Cam Clay model. In the Continuum Representation Model (CRM), a material point yields when \(\bar\tau = \sqrt{\tau : \tau / 2}\), with \(\tau\) the deviatoric stress tensor, reaches \(\mu p\) plus the cohesion. In triaxial compression \(\bar\tau = q / \sqrt{3}\), so the critical state line gives this material's static friction coefficient (mu_fric_s, see the CRM guidance) as \(\mu_s = M / \sqrt{3} = 0.21\).
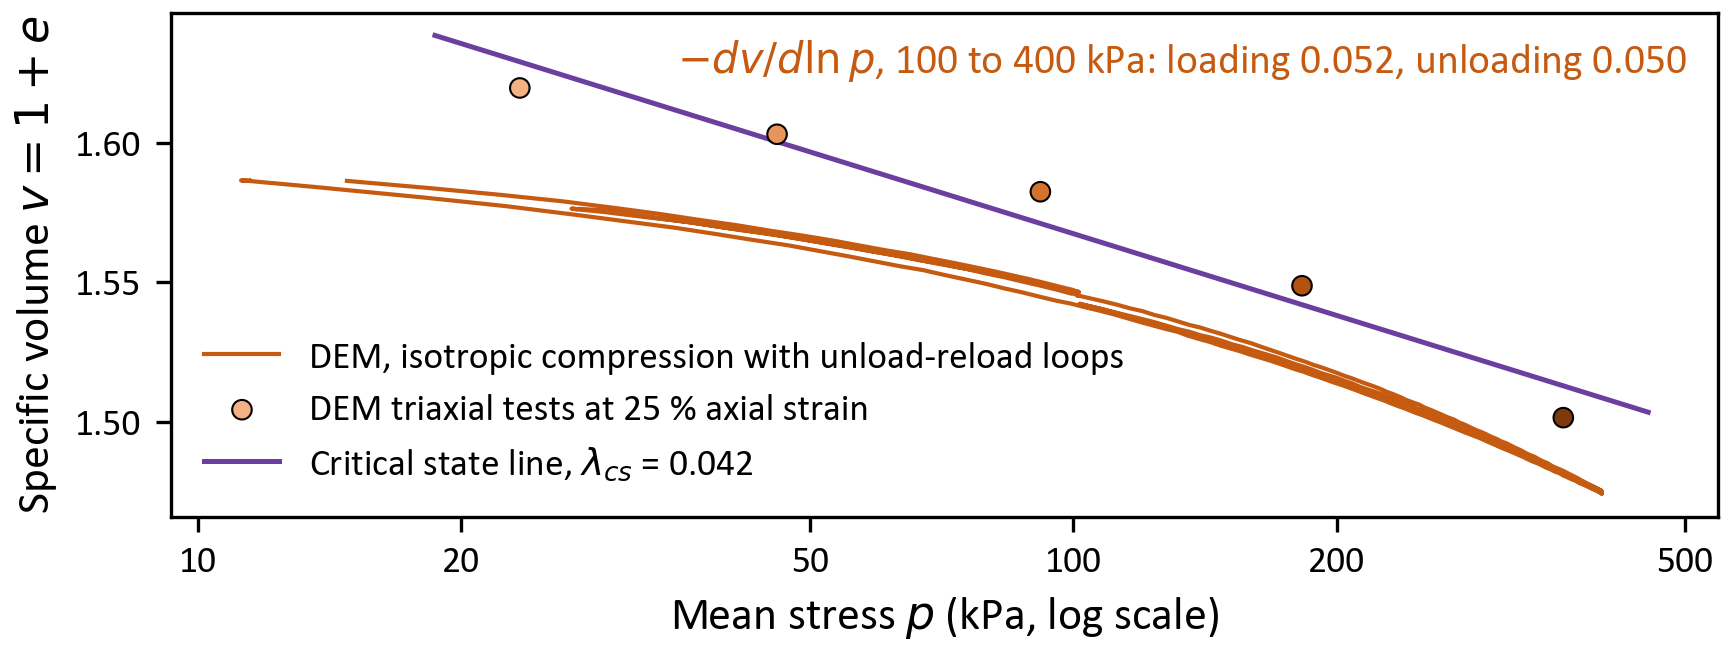
Isotropic compression with two unload-reload loops in the \((\ln p, v)\) plane, with \(v = 1 + e\) the specific volume, together with the states of the five triaxial tests at 25 % axial strain and the critical state line fitted through them.
In this plane the critical state line is \(v = \Gamma - \lambda_{cs} \ln p\), with \(\lambda_{cs} = 0.042\) and \(\Gamma = 1.763\) ( \(p\) in kPa). The dense specimen compresses almost reversibly: after both loops its void ratio returns to 0.5866, against 0.5892 before them, and loading beyond the previous maximum ( \(-dv/d\ln p = 0.052\) between 100 and 400 kPa) is as steep as unloading (0.050). The test therefore gives the unloading slope \(\kappa\) (0.023 between 25 and 100 kPa, 0.050 between 100 and 400 kPa) but no normal compression line. Both \(\kappa\) and \(\lambda_{cs}\) mostly measure the compliance of the softened Hertz contacts: \(\kappa\) grows with pressure, and with steel's stiffness it would be about 100 times smaller.
Density
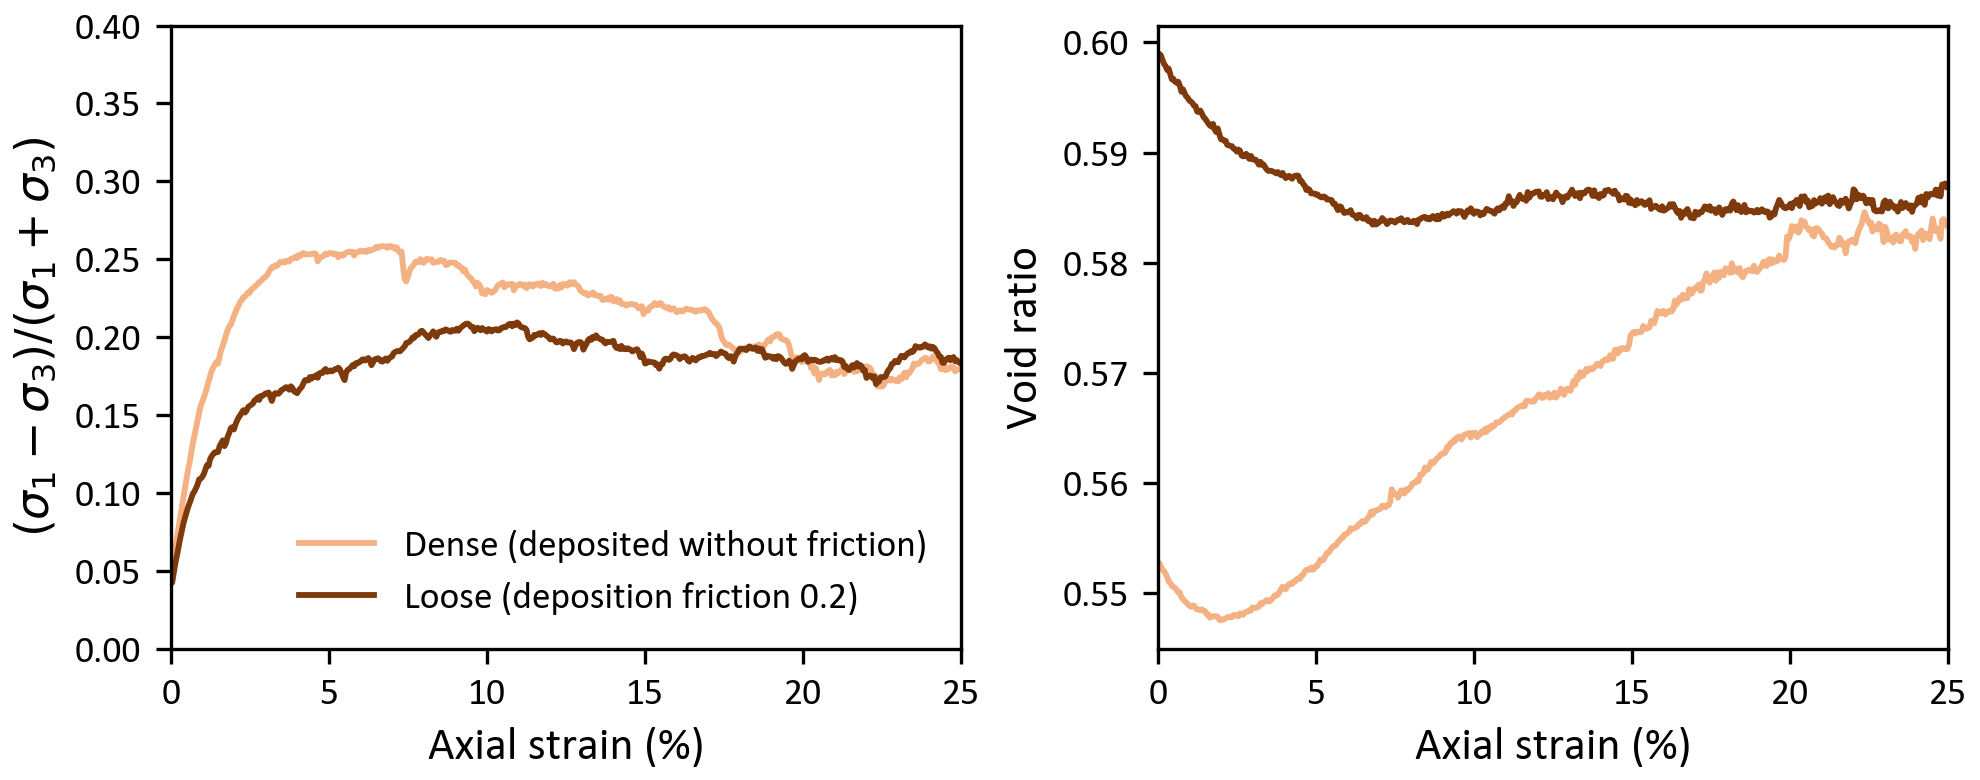
Stress ratio (left) and void ratio (right) against axial strain at 80 kPa for a dense specimen (deposited without friction) and a loose one (deposited with a sphere friction of 0.2), both tested with the same contact parameters.
The dense specimen (void ratio 0.553 at 80 kPa) peaks at a stress ratio of 0.259 (15.0°) at 7 % axial strain and dilates. The loose one (0.599) hardens slowly to 0.209 (12.1°) at 11 % and contracts. By 20 to 25 % axial strain both carry the same stress ratio (0.180 and 0.188) at the same void ratio (0.583 and 0.585): the critical state, reached from both sides.
Contact history
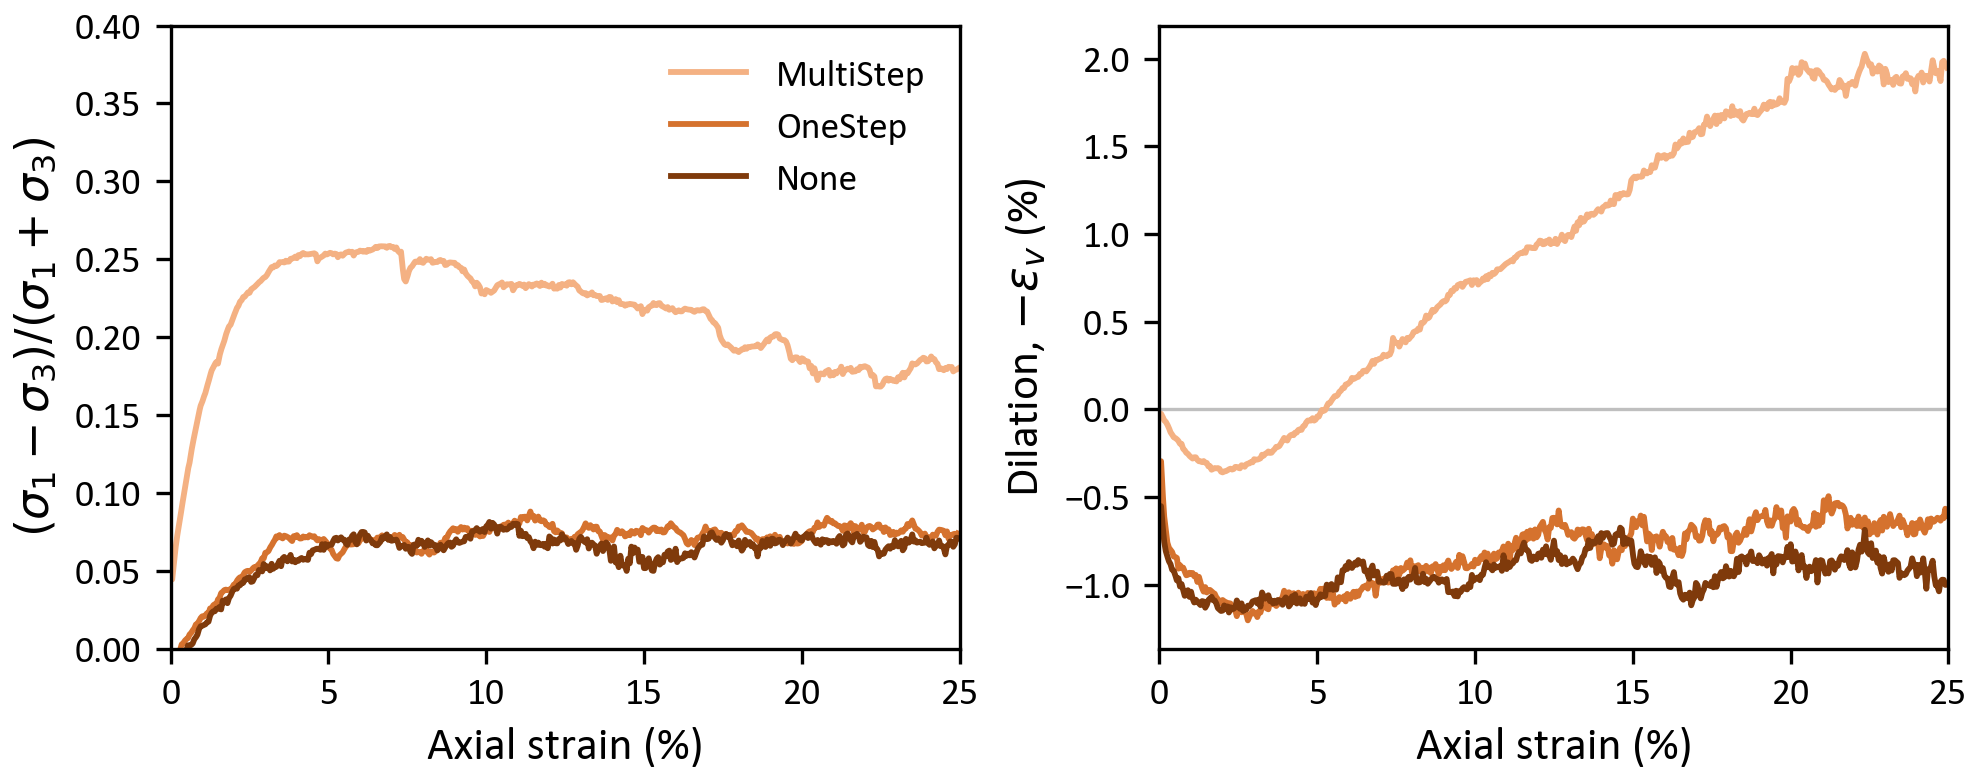
Stress ratio (left) and dilation (right) against axial strain at 80 kPa for one specimen, consolidated with MultiStep and then loaded with each tangential displacement model.
Without the stored tangential displacement, the specimen loses the tangential forces it carried when the model switches. It collapses (a volumetric strain of about 0.9 % by 0.5 % axial strain) and then shears like a nearly frictionless packing: the stress ratio peaks at 0.088 with OneStep and 0.081 with None (about 5°), against 0.259 (15.0°) with MultiStep. This matches the direct shear results, in a different material and apparatus.
Loading rate and checks
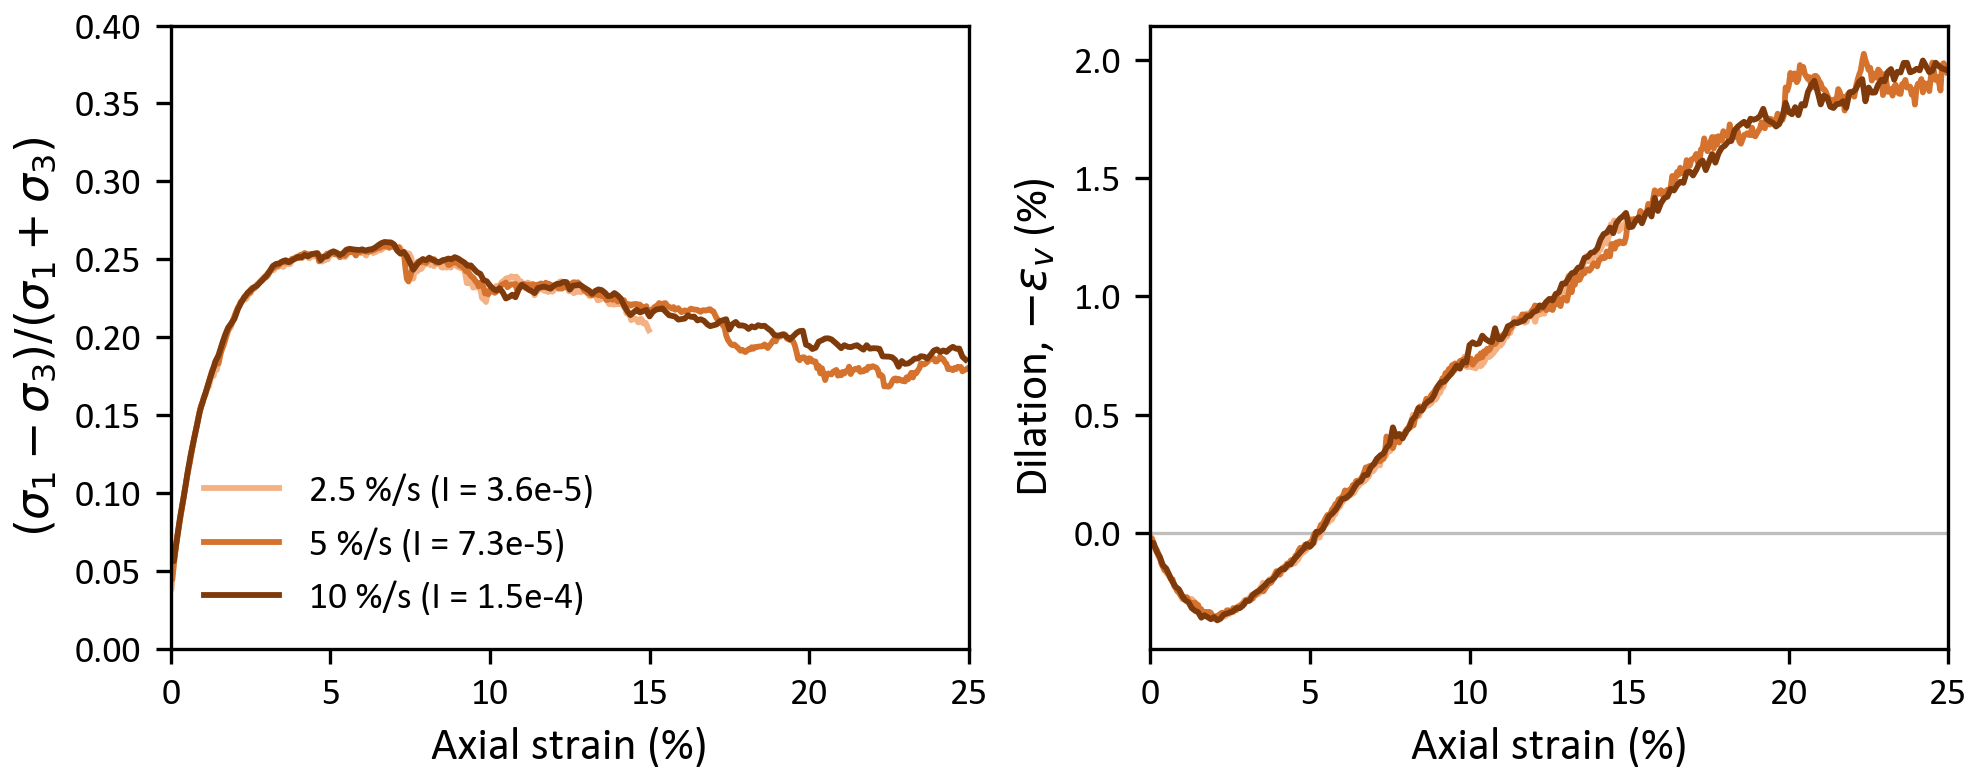
Stress ratio (left) and dilation (right) against axial strain at 80 kPa for three loading rates, with the inertial number \(I\) of each.
Halving or doubling the loading rate leaves the curves unchanged (peak stress ratios 0.259, 0.259 and 0.261), so the tests are quasi-static. Other checks, over all triaxial runs:
- The Love-Weber stress of the whole specimen, computed from the contact forces at the snapshots, matches the boundary stresses. The axial component is within 2 % of \(\sigma_1\). The lateral component is within 1.4 % of \(\sigma_3 (1 - r/R)\), with \(r\) the mean sphere radius and \(R\) the membrane radius, because the membrane forces act at the sphere centers.
- The kinetic energy stays below 1.7 % of the elastic energy stored in the contacts (5.6 % in the run with
None). - No sphere leaves the specimen past a platen edge.
The monodisperse specimen at 80 kPa from 0 to 25 % axial strain, cut at its vertical mid-plane. The spheres behind the cut are drawn in gray stripes set by their heights at the start of the test, so the stripes show the specimen shortening and bulging. The contacts whose normal force exceeds 1.5 times the mean at the start are drawn as cylinders whose radius and color grow with the force.
Programs
The programs are in chrono-projects, in projects/dem_validation. Its README describes their options, outputs and example runs, and the Python scripts that make the figures above from the run folders.
| Program | Tests |
|---|---|
| test_VDEM_directShear_Jenike | direct shear in the Jenike cell, with options for the filling, grooves and rolling friction |
| test_VDEM_directShear_squareBox | direct shear in the square box, and the contact history sample |
| test_VDEM_triaxial_membrane | drained triaxial and isotropic compression with a stress-controlled membrane |
The square-box and triaxial programs also render saved states into the image layers of the force network clips above.
References
- L. Cui, C. O'Sullivan, S. O'Neill, "An analysis of the triaxial apparatus using a mixed boundary three-dimensional discrete element model", Géotechnique 57(10), 831-844, 2007. https://doi.org/10.1680/geot.2007.57.10.831
- J. Fleischmann, R. Serban, D. Negrut, P. Jayakumar, "On the importance of displacement history in soft-body contact models", ASME Journal of Computational and Nonlinear Dynamics 11(4), 044502, 2016.
- J. Härtl, J. Y. Ooi, "Experiments and simulations of direct shear tests: porosity, contact friction and bulk friction", Granular Matter 10(4), 263-271, 2008. https://doi.org/10.1007/s10035-008-0085-3